
THE NUMBERS
Compares diabetes rates today with rates years ago. Trends and disturbing predictions for tomorrow.
INTRODUCTION
Why diabetes is more serious than other illnesses - Summary & discussion of upcoming chapters.
BODY BROKEN
What malfunctions to cause diabetes? Discusses how autoimmunity starts - thymus & natural killer cells
HEALTH PROBLEMS
Diabetes = 12 year loss of life - higher rates of blindness - heart disease - cancer & kidney damage.
CAUSES OF DIABETES
Study after study links diabetes to chemicals in home products - pesticides - cosmetics - food additives & more!
REMISSION
People experiencing true remission - defines honeymoon - suprising facts on beta-cell regeneration.
OBESITY LINK
Research finding same chemicals causing diabetes cause obesity. Discusses obesogens - how & why
REVERSING DIABETES
Time to take conclusions from scientists and put into real-life practice. Are doctors resisting?
DIABETES RATES INCREASING DRAMATICALLY IN U.S.
Here's some numbers that should open your eyes. When looking at the latest diabetes rates from 2012, researchers found that 14% of the adult U.S. population had either doctor diagnosed diabetes or undiagnosed diabetes. Also using 2012 numbers, the American Diabetes Association states that 38% of us have a condition known as prediabetes, which is a nice way of saying we will most likely have diabetes in 5-10 years. Putting these two numbers together, the American Diabetes Association is telling us that close to 50% of the U.S. population had diabetes or prediabetes in 2012 and about 40% of our population will have full diabetes sometime before 2022.
1990 to 2009 - SHOCKING DIABETES INCREASE
Showing how the numbers have increased dramatically in recent years, the Centers for Disease Control published a report stating that diabetes rates grew fastest in the U.S. from 1990 to 2009. For example, during this time period rates tripled for the 0 to 44 year age group, going from 0.6% to nearly 2%. For people aged 45-64, it diabetes increased 150% during this time period going from 5% to 12.5%. When looking at all ages for this 20 year period, diabetes was doubling every 10 years.
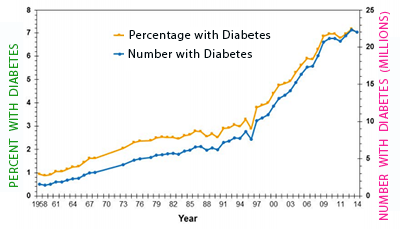
The fact that diabetes for people of all ages was only 1% in 1960 and continues to increase rapidly today, paints a very disturbing picture for our childrens' future, but you should also be very concerned for yourself. The way numbers are increasing yearly, if you don't have diabetes or prediabetes now, you probably will in the next 5, 10 or 15 years - and the baggage of health disorders, pain and suffering that comes with it, well, you wouldn't wish on your worst enemy.The statistics you're about to read on diabetes rates vary as different agencies report different numbers - so explanations will be included. However, the latest figures available show that over 14% of the adult U.S. population has diabetes when counting people with both doctor diagnosed diabetes and those with undiagnosed diabetes. Undiagnosed simply means the person has diabetes, as measured by a fasting blood sugar over 125, but don't know it. The chart above is from the CDC website - it doesn't show the 14% number just mentioned because it includes children and represents only doctor diagnosed diabetes, but does give an excellent visual of how diabetes has been increasing over the past 50 years. As seen from the chart, the percentage of all people of all ages with diagnosed diabetes had gone from less than 1% in 1960 to over 7% in the U.S. by 2014. However, this number is actually lower than the true number with diabetes as many are undiagnosed. To give a clearer picture on this - the CDC did another study, but this time included those with undiagnosed diabetes in their 2014 National Diabetes Statistics Report. Instead of 7%, they now show that 9.3% of people of all ages in the U.S. have either diagnosed or undiagnosed diabetes. It's also important to note that children rarely get diabetes. Numbers from 2012 in the same CDC report state that children under 18 account for only one-quarter of 1% of all diabetes cases, although this number should also change rapidly as child diabetes is now increasing faster than adult diabetes.
DIABETES RATES IN ADULTS
To further clarify diabetes rates in adults, the same CDC report gave numbers for people 20 years and older. This time, the rate increased again showing that 12% of adults age 20 and older had either diagnosed or undiagnosed diabetes. (These numbers were calculated using 2012 figures so are most likely considerably higher today).
Other studies show higher diabetes rates for adults. As described by Dr. Any Menke in the September 8th issue of the Journal of the American Medical Association, a detailed analysis of 2,781 adults from the National Health and Nutrition Examination Survey from 2011 to 2012 showed a diabetes rate of 9.1% for doctor diagnosed cases among all races and a 14.3% diabetes rate when including undiagnosed. So whether it's 12% or 14%, the diabetes epidemic is not increasing solely because of an aging population - if it was, we would only see increases in people over age 60, but we are not. Diabetes rates are increasing in people in all age groups and in both people of excess and normal weight. The Centers for Disease Control reported in 2014 that diabetes rates tripled in the U.S. between 1990 and 2009 for people age 0-44, going from 0.6% to nearly 2%.
When looking at the chart above, the rates for diabetes doubled on average every 20 years from 1960 to 2000, but now, when also taking into account undiagnosed diabetes, it looks as if diabetes is doubling every 15 years and possibly less. As you can see, diabetes in the U.S. is now a train headed down a mountain with no brakes and gaining speed.
UNUSUAL FINDING:
OLDEST ADULTS HAVE LOWER DIABETES RATES
While it is true that diabetes rates are considerably higher when looking at people over age 60, something very interesting apears when separating this group further and looking at diabetes rates for people older than this. For some unexplained reason, older people born before World War II have a lower diabetes rate than those born just after the war. For example, in a study out of the 2011 Annals of Saudi Medicine, people over age 70 had a diabetes rate of about 64%, while people who were 10-20 years younger had a higher 69% rate of diabetes. Why older people born before WWII have a 5 percentage point lower rate of diabetes is certainly a mystery, and certainly takes the steam out of any argument that diabetes is increasing simply because people are getting older. If aging was the primary factor, we simply wouldn't see older people born before World War II with lower rates of diabetes. This detectable pattern will most likely fade as those born before 1945 pass-away, thereby elimininating this important evidence, however, it needs to be remembered as one more piece of critical evidence presented to the jury.
PREDIABETES: A CRYSTAL BALL TO YOUR FUTURE
So let's look at these numbers again. It appears that adults 20 years and older have a diabetes rate of around 12-14%. Now, let's discuss more on the topic of prediabetes that was briefly touched upon earlier. Like a crystal ball into your future, the condition known as prediadiabetes can predict with fairly good accuracy when you will get diabetes and is another reason why you need to find out yesterday if you have prediabetes. Once you know you have it, there is now a lot you can do to stop the train in its tracks - improve your blood sugar numbers and dramatically delay the onset of diabetes and possibly prevent it altogether. This will also be explained shortly.
DIFFERENCE IN DIABETES AND PREDIABETES
While about 14% of us reading this most likely have diabetes - how many of us have prediabetes? While full-diabetes is defined as having a morning fasting blood sugar level of 126 or higher, prediabetes is defined as having a morning fasting blood sugar from 100 to 125. The latest numbers from the American Diabetes Association (published in the journal Lancet) show that when testing blood samples from the adult U.S. population - 38% of us have a fasting blood sugar of 100 to 125 - in otherwords - 38% of us had prediabetes in 2012. The next common sense question - What actually happens inside our bodies that makes us go from healthy - to prediabetes - to full diabetes? Regarding type 1 diabetes, it's just simple math. Autopsy studies of people dying within one year of a type-1 diabetes diagnosis show that 70-90% of their insulin producing beta-cells in the pancreas have been destroyed. But what about people with prediabetes - do they show damage to their pancreas? In similar autopsy studies, if you have prediabetes (a sugar level between 100 and 125), the pancreas' of these people show about a 40-60% loss of beta-cells. This is valuable information as there now appears to be much you can do to delay and prevent full diabetes.
Vol. 379(9833): 2279-2290, Jan 2012
Adam G Tabak, MD, PhD
Dept. of Epidemiology & Public Health
University College London, UK
IF THIS DOESN'T SCARE YOU...
While 38% of us in 2012 had prediabetes, what is extremely concerning about this number is that the same American Diabetes Association study found that 75% of people with prediabetes will in fact develop full-blown diabetes within 10 years. So, let's do the math - 75% of the 38% with prediabetes equals about 25%. Therefore, those of us with prediabetes right now will add another 25 percentage point increase to the current 14% diabetes rate over the next 10 years. Adding these two numbers together gives a total of 39%. Even if 1/4 of the original 14% with diabetes die within 10 years, we will still have over 35% of the U.S. population with full-blown diabetes by 2022. This represents an astounding increase to say the least. Imagine for a moment if 35% of the adult U.S. population has diabetes in 2022 (along with the increased rate of child diabetes), the personal and financial consequences upon society will be horrific. On January 1, 2017, the manufacturer of the diabetic insulin known as Lantis increased its price by 60%. I imagine this will also not be their last increase before 2022 for this expanding and lucrative disease.
TYPE-1 DIABETES IN CHILDREN
Our previous numbers have focused on rates for both type-1 and type-2 diabetes combined among all ages and for adults. To get a handle on just the rates of type-1 diabetes in children, researchers at the National Publich Health Institute in Finland began a global investigation of 27 countries and published their findings in the 1999 journal Diabetologia. For children under age 15, they determined that type-1 diabetes increased on average 3% per year from 1960 to 1996, resulting in a yearly incidence rate of about 15 new cases of type-1 diabetes per 100,000 people. The authors also predicted (back in 1998), that new cases of type-1 diabetes would rise to 30 per 100,000 per year for children worldwide by 2010. Congratulations to the authors - their prediction was quite accurate. In the United States, the CDC reported in their 2014 National Diabetes Statistics Report (pg. 4) that type-1 diabetes was about 29 per 100,000 for non-Hispanic white children ages 0 to 9 and about the same rate for children age 10 to 19.
YOUNGEST CHILDREN HAVE HIGHEST DIABETES INCREASE
An even more worrisome pattern was seen when investigating type-1 diabetes among children of pre-school age and younger. As reported in the September 1997 British Medical Journal, diabetes rates more than tripled for children under age 5 in the Oxford region of the United Kingdome during the 11 years from 1985 to 1996. In 1985 there were about 4 new cases of diabetes per year for these children, however, by 1996, there were nearly 18 new cases of diabetes per year for the same age group. This works out to a doubling of type-1 diabetes among our youngest of children every 4-5 years and is an absolutely shocking increase. Also of interest, this same rapid increase among our littlest children in the UK was also seen in the United States. Certainly, as many scientists agree, there is something in and around us that must be driving this exponential growth in diabetes and is certainly beyond anything than can be explained by genetics or obesity.
TYPE-1 DIABETES GROWING FASTER THAN TYPE-2
There were approximately 500,000 children under age 15 with type-1 diabetes in the world in 2013 (Diabetes Research Clin Pract). In the U.S., looking at people under age 20, there were an estimated 18,436 people younger than age 20 with newly diagnosed type-1 diabetes in 2008-2009 and 5,089 people under age 20 with newly diagnosed type 2 diabetes. Compared to other racial groups, white children had the highest rate of new cases for type-1 diabetes (CDC Report pg.3).
Type-1 in U.S. Children - Colorado
In a study done by the University of Colorado and reported in the journal Diabetes Care, type-1 diabetes was increasing about 2.7% per year for children aged 0 to 17 between the periods 1978-88 and 2002-04. Incidence rates went from about 15 per 100,000 children in 1978-88 to approximately 24 per 100,000 children in 2002-2004. This represents a dramatic 60% increase in about 15 years.
Type-1 in Egyptian Children - Nile Delta
The Nile Delta is a region in northern Egypt in which child diabetes has been increasing rapidly. Researchers at Mansoura University Children's Hospital studied type-1 diabetes rates for the years 1996, 2006 and 2011.
There was more than a 4-fold increase in new cases of diabetes going from 0.7 per 100,000 children in 1996 - to 2.0 in 2006 and 3.1 in 2011. When just looking at the total number of children with diabetes it was about 2 per 100,000 children in 1996 - 15 per 100,000 children in 2006 and about 27 per 100,000 children in 2011. The most common age group was between 5-10 years and was higher in females and more common in rural areas. (Journal Clinical Research Pediatric Endocrinology, 6(1):9-15, 2014)
Type-1 in Chinese Children - Shanghai
Rates are increasing even more rapidly in China, where pollution and parent exposure to chemicals is far worse than in the U.S. For example, between 1997 and 2011, in China's largest city of Shanghai, type-1 diabetes was doubling every 5-7 years with an annual increase of 14% per year (World J Pediatrics)
TYPE-1 DIABETES RISING FASTER IN WHITE CHILDREN
The following diabetes study was done with children less than 20 years old. In 2001, 4,958 of 3.3 million youth were diagnosed with type-1 diabetes for a prevalence of 1.48 per 1000. In 2009, 6,666 of 3.4 million youth were diagnosed with type-1 diabetes for a prevalence of 1.93 per 1000. Looking at all races in 2009, the highest prevalence of type-1 diabetes was 2.55 per 1000 among white youth and the lowest was 0.35 per 1000 in American Indian youth. This means that white children had 8 times more diabetes than American Indian children of the same age. Adjusted for what scientists called "completeness of ascertainment," there was a 21.1% increase in type-1 diabetes over 8 years. In looking at type 2 diabetes - In 2001, 588 of 1.7 million youth were diagnosed with type 2 diabetes for a prevalence of 0.34 per 1000. In 2009, 819 of 1.8 million were diagnosed with type 2 diabetes for a prevalence of 0.46 per 1000. In 2009, the number of children with type 2 diabetes was 1.20 per 1000 among American Indian youth - 1.06 per 1000 among black youth - 0.79 per 1000 among Hispanic youth and 0.17 per 1000 among white youth. After adjustments, a 30.5% overall increase in type 2 diabetes over the 8 year period. In conclusion, these numbers show a rapidly expanding rate of type-1 diabetes in young white children and a rapidly expanding rate of type 2 diabetes in children of other races.
Vol. 311(17): 1778-1786, 2014
Colorado School of Public Health
University of North Carolina
Centers for Disease Control, Atlanta
AGE DIFFERENCES IN DIABETES
To add more clarity to the numbers, let's now look at total diabetes (diagnosed and undiagnosed) for different age groups from numbers the CDC derived from 2011-2012 statistics and published in their 2014 Report. At this time, they reported that diabetes rates for children under 18 was only 1/4 of 1%. For people age 20-44, diabetes rates were 5%. For those age 45-64, diabetes was 17.5% and for those over 65 diabetes was affecting 33% of the group. This report did not give numbers for people over age 75 separately (which in other studies shows lower diabetes rates). For those of you who like tables we can show it this way.
| DIABETES RATES BY AGE 2014 CDC Report - Page 4 |
|
| Under Age 20 | 0.25% |
| Age 20-44 | 5.00% |
| Age 45-64 | 17.50% |
| Age 65 and up | 33.00% |
RACIAL DIFFERENCES IN DIABETES
Another fact that raises more questions is why diabetes rates differ so dramatically among races? When breaking down the numbers, the 2014 CDC Report stated that while whites have an adult diabetes rate of about 10% - blacks and Hispanics have an adult diabetes rates more than double this at over 20% (2012 figures). If trends continue with a doubling of diabetes every 12-20 years (since 2012), the African American and Hispanic populations will have a whopping 40% diabetes rate sometime between 2012 and 2020 and possibly sooner - with whites reaching that number 10-20 years after that. The fact that African American and Hispanic populations have higher rates of diabetes is a fascinating observation and studies show this may not be coincidence. Interestingly, in several studies discussed on the following pages, African Americans and Hispanics have far higher exposure to a class of chemicals known as "thallates" (actually spelled "phthalates"). In fact, in a large study of African Americans to be discussed shortly, they were found to have nearly twice the blood levels of this chemical than whites, and interestingly, have twice the level of diabetes than whites. Higher levels of phthalates has been shown in many different studies to be associated with higher rates of diabetes. Some cultural practices also suggest a potential for higher use of this chemical as it is typically used as a thickening agent in plug-in air fresheners, perfumes, colognes and in a variety of cosmetics and skin lotions for dry skin.
When looking at racial differences in this 2011 study, total diabetes (a fasting blood sugar 125 or higher) was 11% for whites - 20% for Asians - 22% for African American - and 23% for Hispanics. Hispanics and African Americans have similar diabetes rates in most studies and typically twice the rates of whites. Again, these figures were from 2011-2012 so they are most likely considerably higher today (2017).
As shown below, treating diabetes is quite expensive due to daily insulin shots, resulting in costs of about $1000 per month for every person with diabetes. Any way you look at it - if 30-40% of the adult population has diabetes in the next 10 - 15 - 20 years then each of us will be paying an additional $200-$300 out of pocket each month to care for adults and children with diabetes. Personally, I'd like to put that money somewhere else - for example, using it for replacing the causes of diabetes - which can be done. The obstacle here being that many companies make considerable profits from the compounds being linked with diabetes so letting go won't be easy. Obviously, no society can afford increases in insurance premiums of this amount to pay for diabetes and this literally has the potential to bankrupt our medical insurance system and decimate the quality of life for the vast majority in Americans.
PREDICTIONS DRAMATICALLY WRONG
BY WORLD HEALTH ORGANIZATION (WHO)
I wasn't sure whether to laugh or cry when looking at future predictions of diabetes by government agencies. The Centers for Disease Control (CDC) and World Health Organization (WHO) typically look at past trends of an illness to predict future rates. This is helpful in making sure financial and medical resources will be in place when needed. Well, the WHO did this in 1998 and the CDC did this in 2001, and to say their predictions were wrong is an understatement of many magnitudes and would be laughable if not for the severe consequences all of us will soon face. Here is a direct quote from the scientists involved in the WHO report published in 1998, from the journal Diabetes Care, Volume 21, page 1414.
Think about this - the WHO predicted in 1995 that 5.4% of the world would have diabetes by 2025 (which includes both diagnosed and undiagnosed diabetes and only for people above age 20) - So, just how far off were they? Now, that we are 20 years into the future let's go to the WHO website and see how accurate they were. In the Diabetes section of their website under "Key Facts" - under the "Media Centre" tab they state the following:
So, to review one more time - the World Health Organization kept the calm by predicting in 1995 that the world would have a diabetes rate of only 5.4% by the year 2025. But here, on their website today, they state that in 2014 the world was showing an 8.5% rate of diabetes. In other words, the rate of diabetes is each year is not advancing at a steady peace like they thought - instead, the percent of any population with diabetes is continuing to rise faster each year after year after year. While the World Health Organization predicted our planet would have a 5.4% diabetes rate in 2025, we actually hit 5.4% around 2005 - some 20 years ahead of schedule - and those numbers should make you very nervous.
What's very interesting is that diabetes rates differ dramatically from one country to the next. For example, some impoverished countries in Africa have a diabetes rate of under 1% while Saudi Arabia has one of the highest adult diabetes rates in the world clocking in at over 30% - and that was back in 2010. What risk factors do they have in Saudi Arabia that poor areas of Africa with 1% diabetes rates don't? Well, along with the hundreds of oil wells and chemical refineries dotting the horizon and spewing toxic gasses into the air, when we investigated further we found what could be one of their biggest contributors. Unlike most developed countries that dispose of trash in landfills, the Saudi's have opted instead for burning trash at ground level. In the United States this is illegal because burning household trash in open areas creates the chemical dioxin at very high levels - one of the most potent diabetes inducing chemicals on the planet. Unlike other chemicals that break down over time- dioxin builds up in the body and fat tissues and wreaks havoc on the immune system at infintesimal levels of parts per trilliion. When trash containing either plastic - chlorinated white paper or colored paper is burned at the low temperatures typical land fills (or backyard barrels) - it forms very high levels of dioxin, which then floats down from the sky onto neighborhoods surrounding the source. The chemical soot from the burning trash contains dioxin and lays unseen among the other dirt particles on the ground. Children then go outside and play on this contaminated ground, and as children will be children, they frequently move fingers from the ground to their mouths.
Getting back to the WHO report and to make sure we truly compare apples with apples, we do know that diabetes in the U.S. was about 14% for diagnosed and undiagnosed for people above age 20 in 2012. This means the U.S. rates were more than double the WHO's 2025 prediction 11 years before 2025!
CDC DIABETES PREDICTION EVEN FURTHER OFF THE MARK
The World Health Organization is not alone, the Centers for Disease Control (which represents only numbers in the United States), did their own diabetes prediction study, but this time they made a prediction for rates for the year 2050 instead of 2025. Here is a direct quote from the scientists involved in the CDC report published in the 2001 journal Diabetes Care, Volume 249, pg 1936.
So, using their best statisticians and researchers, the CDC told us back in 2001 that we could expect to see about 7% of the population with diabetes by the year 2050. Let me say this again, the CDC predicted back in 2001, as published in the journal Diabetes Care, that by the year 2050, the U.S. population will most likely have a diabetes rate of 7%. Unfortunately, their estimates were light years off target! Now that we are 15 years in the future we can do a little fact checking - In looking at the latest CDC chart of diagnosed diabetes of all ages, we can see that diabetes won't hit 7% in 2050 - and that's because it hit 7% back in 2014 - 36 years ahead of schedule! In fact, if counting those with undiagnosed diabetes, and looking at the trends mathematically, the U.S will most likely have a diabetes rate of at least 50% or higher by 2050 - not the 7% predicted by the 2001 CDC Report.
FINANCIAL COSTS UNSUSTAINABLE
FOR DIABETES IN 10, 15, 20 YEARS
Since diabetes rates are increasing so dramatically, it makes sense to do a study on the costs of diabetes. Such a study was done and published in the September 2014 journal Diabetes Care. One of their main findings - the cost for taking care of someone with diabetes was about $11,000 per year in 2014. This covers such things as daily insulin, needles and doctors visits. The report went on to say that the economic burden associated with diabetes - prediabetes - and diabetes in pregnancy exceeded $322 billion in 2012, consisting of $244 billion in excess medical costs and $78 billion in reduced productivity. What's important to understand (and helpful for predicting the future), this 2012 cost is nearly 50% higher than the $218 billion cost from diabetes just 5 years earlier in 2007.
When looking at the cost per person, treating someone with diabetes in 2012 averaged $10,970 per year, $5,800 for diabetes in pregnancy and $4,030 for undiagnosed diabetes and $510 for prediabetes. Payments to doctors and drug companies treating those with diabetes comes primarily from Medicare and insurance premiums. The report stated that each person in the U.S. (including those who don't have diabetes) is paying an additional $1,000 per year out of pocket to cover the medical expenses for people with diabetes. In other words, if rates of diabetes were the same as back in the 1950's and 60s, your insurance premiums would be on average about $1000 less per year - or looking at this another way, your employer could be paying you an additional $1000 per year if diabetes rates were the same as 50 years ago. Unfortunately, diabetes rates in 2014 were about 15 times higher than in the 1950's and 60's and continues to grow.
Diabetes on Track to Bankrupt the U.S. Economy if Not Reversed
As shown in the first journal summary from the CDC, diabetes has increased at least 7 fold from 1960 to 2014, going from 1% to 7%. If we count people with undiagnosed diabetes and those over age 20 it is over 12%. In a report published by the American Diabetes Association, the economic burden associated with diabetes (all ages) - prediabetes - and diabetes in pregnancy exceeded $322 billion in 2012, consisting of $244 billion in excess medical costs and $78 billion in reduced productivity. This is 48% higher than the $218 billion cost in 2007. The cost per person with diabetes averaged $10,970 per year for diagnosed diabetes, $5,800 for diabetes in pregnancy and $4,030 for undiagnosed diabetes and $510 for prediabetes.
CHEM-TOX COMMENT: If the trend continues, diabetes will double again in another 10-15 years by 2025 or 2030, resulting in 20% or more of the population with diabetes (and these may be underestimates). It will then double again 10-15 years later resulting with 40% of the population having diabetes by 2040 or 2045. Certainly, having 40-50% of the population with diabetes is financially unsustainable in any society as diabetes is a very costly illness at about $1000 per month. If diabetes doubles again 10-15 years then 80% or more of the population will have diabetes by 2055.
PRE-DIABETES PREDICTS EXPLOSION OF DIABETES IN 10 YEARS
While CDC estimates for the year 2014 show about 12% of the U.S. population had diagnosed or undiagnosed diabetes, it has also been found that about 30% of the adult population (86 million) had pre-diabetes according to a report on the CDC's website - see report. Prediabetes is defined as a fasting blood glucose level of between 100 and 125. This is of great concern as other research from the European Diabetes Association show the majority of people with pre-diabetes develop diabetes within 10 years. Therefore, if 12% of the adult U.S. population in 2016 has diagnosed or undiagnosed diabetes, and another 30% of those remaining have prediabetes, we could conservatively say in 7-10 years - that another 20% of the U.S. population will have diabetes on top of the current 12%, resulting in more than 30% of the U.S. population having diabetes in 2025-28. This numbers are much higher than current predictions. If the rates continue, then, by at least 2045 or 50, more than half the U.S. population will have diabetes. With reports showing the cost for a person with diabetes is about $12,000 per year - the financial costs for treating half the population with diabetes would be financially unsustainable resulting in a complete collapse of the current medical insurance finance system.
THIS IS WHERE IT GETS SCARY
While the cost of treating someone with diabetes is expensive - at about $12,000 per year - if it was only for 1% of the population (as in 1960), then costs are spread out through the population as a whole and not that significant. However, diabetes rates are no longer at 1% and have now increased to about 10% in 2014 for all ages if including undiagnosed diabetes, and about 14% for those more than 20 years old. So, this is where it gets scary - if diabetes rates will in fact double over the next 15 years (as suggested by looking at rates and expected growth of prediabetes) then by the year 2022, 30-35% of the U.S. population over age 20 will have diabetes (double this for blacks and Hispanics). So, if you and I were paying $1000 per year out of pocket in 2014 for people with diabetes - then by the mid 2020's, we will each be paying closer to $2000 per year and with medical inflation, probably closer to $3000 per year. Folks! that's 200-300 bucks out of your pocket every month just to care for this one illness. This doesn't even take into account that people with diabetes then develop other illnesses at higher rates as they get older, thereby compounding the problem even further.
Diabetes 1 in 300 in U.S. by Age 18
Increasing 2-5% worldwide each year
Vol. 39(3): 481-497, Sep 2010
Dept. of Pediatrics
Barbara Davis Center for Child Diabetes
University of Colorado, USA
Diabetes Practically Unheard of in 1800's
The 1892 edition of Osler’s Principles and Practice of Medicine devotes 10 pages to diabetes, compared with 65 for tuberculosis, and mentions that only 10 of 35,000 patients treated at Johns Hopkins were affected. Massachusetts General Hospital admitted 47,899 patients over the period 1824–1898, of whom 172 (0.004%) were diagnosed with diabetes.
Tasting Urine Main Diagnosis Method in 1850's
Until 1851, diagnosis of diabetes was based on the taste of the urine, which may have limited screening enthusiasm, although the physician in charge “sometimes called upon the house physician to apply this test,” and self-monitoring was occasionally recommended (5). Improved access to urine tests probably accounts for the increased frequency of diagnosis from 1885 onwards, and by 1923, urinary glucose measurement was available in many U.S. drugstores at a cost of 1¢ per test (6).
Diabetes Always Fatal to Children Before 1921
Despite reliance on urine tests, the near uniform fatality of childhood-onset cases in series from the preinsulin era testifies that there was little confusion with renal glycosuria. Morse cites Carl von Noorden, the great European authority of the time, who said that “with few exceptions diabetes in childhood knows no cure, no matter how mild it may appear in the beginning, nor how gradual its development in the first months or even years.” His experience was that children under age 7 years with the severe form of the disease survived 18 months to 2 years, while those with “mild glycosuria” lived 3–6 years, and that “the usual statement that the younger the child the shorter the course is true” (7). Joslin reported in 1923 that 86% of children presenting under age 16 years had previously died in ketoacidosis (6).
There is of course no way of knowing how many cases of diabetes had been missed, but one small clue suggests that we should not underestimate the diagnostic skills of our predecessors. A strong family history was already recognized as a favorable prognostic marker, and Joslin remarked that “all cases which have come to my attention of youthful patients with diabetes living for very long periods of time have been hereditary” (6). If Joslin was familiar with maturity-onset diabetes of the young, as Tattersall believed him to be (12), this could provide useful internal evidence that type-1 diabetes was truly rare.
How Common was Diabetes Before Insulin?
Insulin was discovered & produced in 1921?
In the absence of epidemiological studies, the only sources available to us are clinic series and mortality statistics. The reported death rate from diabetes for children under 15 years of age was 1.3/100,000/year in the U.S. in 1890, as compared with 3.1/100,000/year in 1920 (6). These results are comparable with those for Denmark, with estimates rounded to 2/100,000/year under age 15 years for 1905–1909 and 4/100,000/year for 1915–1919 (13). Data for Norway can be derived from Gundersen (14) and suggest an incidence rising from 2 to 7/100,000/year over the period 1900–1920. Clinic series are less helpful, since they typically describe the percentage of referrals in each age category. By 1922, Joslin was able to report that 366 (14%) patients in his personal series had been diagnosed in the first two decades of life, with 149 presenting in the first decade. He also comments that the proportion of children in his caseload was rising, although this may have been due to his special interest in the condition, which was readily passed on by other physicians because of the “general feeling of the hopelessness of the disease in children.” Other series quoted by Joslin give a much lower proportion of children under the age of 10 years, ranging from 0.5 to 1.4% of the total, and one Japanese series of 680 patients contained no children at all. His view was that “the increase in the percentage of cases in the first decade as compared with a generation ago speaks emphatically in favor of the better diagnostic methods of today rather than of actual increase in the frequency of the disease” (6), and at this remove of time we must rest content with this conclusion.
We may therefore conclude from this limited evidence that childhood diabetes terminating in ketoacidosis was uncommon but well recognized in the decades before insulin, that mortality statistics show an increasing incidence over the first two decades of the century, probably due to greater awareness of the condition, and that mortality statistics from the U.S., Denmark, and Norway suggest an incidence range of 2–7/100,000/year under age 15 years for the period 1900–1920.
Insulin Invented in 1921 - Stops Fatalities from Diabetes
Canadian physician Frederick Banting and medical student Charles H. Best discovered the hormone insulin in pancreatic extracts of dogs. On July 30, 1921, they injected the hormone into a diabetic dog and found that it effectively lowered the dog's blood glucose levels to normal. In fact, Dr. Banting was awarded the Nobel Peace Prize for his accomplishment.
Diabetes Still Increasing after 1920
The period between World War I and II saw great advances in public health and the collection of social statistics. A landmark was the U.S. National Health Survey of 1935–1936. This was a doorstep sampling survey of 2.5 million people living in 700,000 households in 83 cities. The reported rate of diabetes for the age-group under 15 years was 0.35/1,000 for boys and 0.41/1,000 for girls (15). For comparison with our other numbers before 1920 this is 35 per 100,000 for boys and 41 per 100,000 for girls. Remember? Back in 1890 it was just over 1 per 100,000 and in 1920 it was up to about 7 per 100,000. In contrast, National Health Interview Surveys undertaken later in the century gave prevalence figures of 1.30 and 1.60/1,000 under age 16 years for 1973 and 1976, respectively, with rates (this time up to age 18 years) of 1.30 for both sexes for 1979–1981 and 1.20 for 1989–1992 (16).
Diabetes Rates in Norway
The main source of incidence and prevalence data for this period is Scandinavia. A Norwegian government survey in 1934, based on a questionnaire to doctors, identified a national total of 253 children under the age of 15 years, giving a minimum prevalence of 0.28/1,000, but ascertainment was undoubtedly incomplete (17). More detailed information about the incidence of diabetes in Norway is available from two retrospective surveys in Oslo and Bergen. Westlund examined all cases of diabetes admitted to hospital in Oslo over the period 1925–1954. His main aim was to document the effect of food rationing during World War II on the incidence of diabetes (Fig. 1), and to do this he needed to establish accurate baseline rates both before and after the war. The assumption was that all cases would be admitted to hospital at diagnosis, and the aim was therefore to identify all first admissions. A total of 4,251 individual patients were identified, and the incidence of diabetes under age 30 years remained relatively constant over the period 1925–1954; the average incidence under the age of 15 years can be estimated as 4.1/100,000/year from the data provided (18).
Meanwhile, an independent Norwegian survey had been conducted in Bergen. This was then a town of some 100,000 inhabitants with one hospital. Per Hanssen made a heroic effort to identify all cases of the disease over the period 1925–1941. Cases were identified by a retrospective search of hospital admissions from 1910 to 1941 and by examination of a city register established in 1940–1941 to ensure that patients with diabetes received food supplements under wartime conditions. In addition to this, a questionnaire was sent to all doctors in the city asking them to register all cases of diabetes prospectively over a 6-month period beginning March 1941, and death certificates and postmortem reports were also checked for the whole period. This exhaustive search identified 402 patients with diabetes alive in 1941, 46% of whom were receiving insulin and a further 392 who had died over the preceding 16 years. The author concluded that the total prevalence of diabetes had doubled over the 15-year period, but this increase was confined to the older age-groups and, as in the U.S. (19), was attributed to the increasing age of the population. A total of 40 individuals developed diabetes under the age of 20 years, equivalent to an incidence rate (based on the 1934 census) of 7.9/100,000/year for this age-group over the period 1925–1939 (17). Although the confidence intervals around such an estimate will be wide, the overall agreement with the Oslo data is good.
The war also had an indirect impact on Sweden, where, based on ration cards issued in 1942, the State Institute of Human Genetics and Race Biology collected national data on the number of people with diabetes in the population. Ascertainment was checked in Stockholm by a survey of patients receiving hospital treatment over the period 1938–1942, and this identified an additional 14% of patients not receiving ration cards. At that time, the city contained 72 diabetic children under 15 years of age, giving a prevalence of just under 1/1,000 (20). The Pediatric Clinic in Vasterbötten in Northern Sweden retrospectively reported a wartime incidence of 10.2/100,000/year. This estimate is the highest available for the period, and it is therefore of interest that Vasterbötten remained a high incidence area, with rates rising to 37.9/100,000/year by 1973–1977 (21).
WE REALLY ARE RUNNING OUT OF TIME
It is currently January of 2017 at the time of this writing and the most recent number we have for diabetes is 14% from 2012. We hear reports that global warming will cause dire consequences in 100 years - but with diabetes on track to hit 50% of the U.S. population in 15, 20 or 30 years and with African Americans and Hispanics hitting that number in 10-20 years - global warming may be the least of our worries. It is noteworthy to mention that generating concern about diabetes should be much easier than with other health and environmental issues because it has the potential to cause severe health problem among so many people right now and in the very near future - even those in politics who often appear conscience challenged should be more willing to take notice because it could affect them at any moment. Unlike most other serious diseases, once identified, prediabetes can be slowed, and possibly reversed by eliminating exposure to the now dozens of identified environmental sources along with preventing glucose beta-cell damage now shown to occur from higher sugar levels. This will lead to lower autoimmunity and increased growth of new beta-cells (which has been shown to occur in both animals and humans). Also, by bringing attention to the environmental causes of diabetes, we are simultaneously addressing many other health problems linked to the same environmental sources. For example, while living close to highways and breathing car exhaust has been linked to a 30% increase in diabetes, it also has been linked with increases of child asthma, autism, Alzheimer's and cancer. Along with these increasing health problems, many chemicals linked to diabetes are the same ones that contribute to global warming. For example, car exhaust again. By converting our vehicles to run off natural gas immediately (which can be done for the cost of about one or two months of diabetic supplies)), rates of diabetes would drop quickly along with the carbon that accelerates global warming. So the next time you get a chance, spend a few dollars on an inexpensive glucose test meter from your store of choosing and find out if you have prediabetes with numbers from 100-125 or if you are closer or better than the national average of around 82. Seven months ago my morning blood sugar numbers were averaging in the prediabetes range of around 110 - today they are closer to 95. Unfortunately, my 13 year old son was diagnosed with type-1 diabetes in May of 2016, but thanks to him, I've been able to learn about this disease and push back my diabetes clock by many years or decades.
TIME TO PANIC
Regarding the CDC's dramatically wrong estimate discussed earlier on diabetes predictions for 2050, it may not have been 100% their fault. While one can argue they may have done this intentionally to avoid "panic" over increasing diabetes rates, their predictions may have been so far off because back then they believed that diabetes rates were increasing through what is called a linear trend. This simply means that when drawn on a line graph, the line continues in the same direction and at the same angle. Unfortunately, this was not the case as more recent line graphs show a dramatic steepening of the line which is known as an exponential increase. In other words, things are getting a lot worse now and in a lot less time. Translation? It's time to panic...... Also, for some reason there is a large delay in government agencies reporting more recent diabetes rates. We don't need numbers from 7-10 years ago, we need numbers from last year so we can truly see how fast this epidemic is increasing. We also need the government to report not just diagnosed diabetes but also include figures with undiagnosed diabetes and keep up to date prediabetes numbers as well.
THE TEST YOU SHOULD HAVE DONE YESTERDAY
Diabetes actually gives plenty of warning before entering your life. The problem was you didn't hear it knocking on your door because you didn't go to the drug store to buy a simple $10 finger-prick glucose test. Without question - everyone should have their blood sugar tested at least twice a year. This means you - your children - grandma - your husband - wife and even your newborn baby - Yes, even babies are now being diagnosed with diabetes!
MUCH CAN BE DONE TO REVERSE HIGH BLOOD SUGAR
The reason for the test is simple - if you discover your fasting blood sugar is above 90 or moving into the pre-diabetes range with readings of 100-125, there is much you can do to reverse this which wasn't known even 5 years ago. In fact, much of this information is so new that, unless your doctor has spent considerable time researching medical journals, even he or she is not aware of the latest research. For example, since high blood sugar alone can damage the pancreas through greatly increased free-radical damage (Mount Sinai School of Medicine), just by eating less carbohydrates at meal-time will prevent those damaging glucose spikes of 150, 200 or higher. Scientists call this "glucose toxicity" and believe it is the last dominoe that pushes someone into full dibetes. Along with this, scientists have now identified dozens of endocrine disrupting chemicals in consumer products that damage the ability of the pancreas to produce insulin or cause it to malfunction. These same environmental factors have been shown to prevent insulin from attaching to insulin receptors on your cells which then prevents glucose from entering the cell, thereby raising your blood sugar to abnormally high levels.
So, think about this - if you know you are getting a closer to diabetes by seeing numbers higher than normal on the test, you can start testing your blood sugar 30 minutes after eating and adjust your meals to keep your numbers below140. Just this simple practice alone would dramatically slow damage to your pancreas (and if done in conjuction with avoiding other circumstances linked to diabetes) it would greatly increase the likelihood of achieving a daily net-increase in beta-cells instead of a net-loss.
THE TEST TAKES ONE MINUTE
The test is simple and takes only a minute. It can even be done at home if you'd like to save a trip to the doctor's office. The test is called a glucose test and costs $10-$15 from the pharmacy department at Walmart, Krogers, Publix or any drug or grocery store. It is usually right on the shelf in the diabetes section of the pharmacy. Test kits range in price greatly but most stores sell their own store brand for 75% less than name brands. I've even seen some stores give away the meters (then making it back when you buy their test strips). Some test kits don't contain the test strips so you'll most likely have to buy those separately (read the label). Once you buy the meter, you can buy a box of test strips for less than $10.
After shelling out the 10 or 20 bucks for the test kit and strips, take it home and read the instructions so you can become friends. When you wake up the next morning simply prick your finger before breakfast with a nearly painless device called a lancet, included in the kit - and put the small drop of blood from your finger onto the test strip in the meter. After 5 seconds you'll see a number and hopefully it will be around 80 as it is for most people. Apparently, people with numbers around 75 have a very healthy pancreas, but most people today test in the low 80's so that's a good target number for starting. The meters do have a margin of error of about 10% so if you want to be more accurate you can test twice and average the two,
If your number is from 90 to 99, your pancreas is most likely sending up its first signal flare that its beta-cells are being overworked. If it's between 100 and 125 on two separate occasions, you officially have what is called prediabetes. Prediabetes is a signal that your pancreas has most likely lost an estimated 30-40% of its insulin producing beta-cells or you are approaching type-2 diabetes. Type-2 diabetes means that something is not only malfunctioning in your pancreas (people with type-2 diabetes have significant beta-cell loss too), but also, there are additional problems with the insulin receptors and glucose transport process into your muscle and body cells.
Interestingly, type-1 diabetes was previously found only in children - and why it was orginally called juvenile diabetes. Today, the word juvenile diabetes doesn't apply since type-1 is appearing more and more frequently in adults as well. On the flip-side, while type-2 diabetes previosly occured only in adults, it is now greatly increasing in children ages 10-18. Since the line between type-1 and type-2 has now blurred significantly - doctors have coined the pharase - "type 1.5" - which describes people who are experiencing the symptoms of both autoantibodies against their pancreas and also signs of insulin resistance (where the insulin that is present in the blood is not doing its job). If a child with type-1 is given additional insulin because of a high glucose level, and the numbers improve little within 30 minutes, this strongly suggests they have type-1.5 rather than just type-1.
HOW DOES YOUR PANCREAS COMPARE TO PEOPLE OF DIFFERENT AGES?
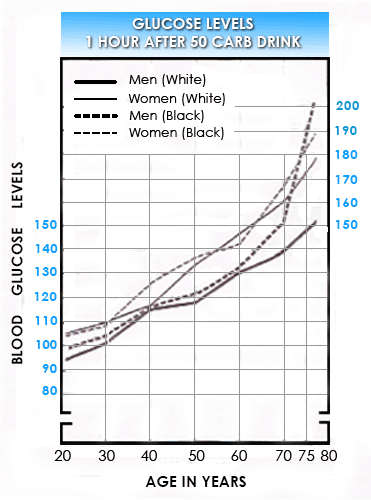 The graph at left shows average glucose numbers for more than 6,000 people one hour after drinking a 50 gram carbohydrate sugar drink. Using this information - you can see how well you compare to people your own age. In other words, by giving yourself an easy to administer drug store glucose test - you can see if your pancreas works like someone who is 20, 30, 40, 50, or even 75 years old - and if the numbers don't look good, unlike what you may have heard before, we now realize there is much you can do to reverse your numbers and bring them closer to someone of a much younger age.
MAJOR POPULATION CDC GLUCOSE STUDY
The Centers for Disease Control (CDC) wanted to determine normal glucose levels for people of different ages across the country. Knowing this would identify patterns and help predict what age groups are most likely to develop diabetes (since higher numbers show a greater risk).
The study was authored by Caroline C. Garst at the Division of Health Examination Statistics. Results in the previous graph and table below show average glucose levels for people across the United States one hour after drinking a 50 gram glucose sugar drink. Results are from 6,672 persons who were selected as a representative sample of the U.S. popuation back in 1960. The large sample size should give us a rather accurate number of what was considered normal at that time. Unfortunately, we were not able to find any newer studies with this much detail over a wide range of ages (For some reason, the newer CDC reports group people into age groups spaning 30+ years). On the positive side, being an older study would actually give us a more representative idea of "normal" since people back then were exposed to far less chemcal compounds linked to causing autoimmunity or abnormalities in glucose control systems in the body.
While most glucose tolerance tests today are done in a doctor's office with 75 grams of carbohydrates, this test is much less stressful on the pancreas and duplicates more of a "real-life" situation as it was done with a 50 gram carbohydrate glucose drink. This is something that could be easily duplicated in the home without major stress on the body.
CHOOSING A DRINK FOR THE TEST
Although purchasing glucose is possible for making an exact 50 gram drink (you can purchase glucose tablets at any pharmacy and simply mix 50 grams of tablets in water), you can also get relatively close to duplicating this test by using a soft drink of your choosing. You just need to measure out the correct number of ounces to equal 50 carbs. For the sake of simplicity, no measuring would be needed with a 16 ounce bottle of Sprite since it has just slightly under 50 carbs for the entire 16 ounce bottle. If Sprite is not your thing, you could use Coke, which has 52 carbs in a 16 ounce bottle. So, removing two teaspoons from the 16 ounce bottle would give almost exactly 50 carbs for the bottle.
| Numbers below are taken from the previous CDC graph but entered into table format Blood Glucose Levels 1 Hour After Drinking a 50g Glucose Drink |
||||
| AGE | MEN (White) | WOMEN (White) | MEN (Black) | WOMEN (Black) |
| 20 | 95 | 105 | 100 | 104 |
| 30 | 101 | 110 | 104 | 109 |
| 40 | 115 | 117 | 116 | 126 |
| 50 | 118 | 133 | 121 | 137 |
| 60 | 131 | 147 | 132 | 141 |
| 70 | 140 | 160 | 150 | 167 |
| 75 | 148 | 171 | 183 | 181 |
Once you've decided on the perfect drink, the most accurate way to do this is in the morning within an hour or two after waking up and before eating any food or drink. If this is difficult to do in the morning, you could do it in the afternoon, but should wait at least 4 hours after eating.
TEST PROCEDURE
To begin the test, drink the entire drink over a few minutes, get out a piece of paper, look at a clock and write down the time. Set your kitchen timer or stopwatch on your phone and exactly 60 minutes later, give yourself the finger prick glucose test and write the number shown on the meter onto your piece of paper. Then, find your sex and race column on the chart and find the glucose number in the column that is closest to your number on the paper. Next, look at the farthest left column which shows the age of people who typically have that glucose number and write that down. Then press the piece of paper against your right stomach area to show your pancreas that he or she is working like a pancreas of XYZ years old. Just kidding about the last sentence, but you certainly have permission to give your pancreas an "atta-boy" if the age on the chart is lower than your actual age (meaning you have the pancreas of a younger person), or a good tongue lashing if the age on the chart is higher than your actual age (meaning you have a pancreas of an old man or woman). As you can see, if you do have a pancreas functioning like that of someone who is considerably older, you are then far more likely to develop diabetes at a younger age. But again, since much has been learned about diabetes and regeneration of the pancreas, there is now much you can do to turn back the clock, thereby giving your pancreas bragging rights of being equal to someone of a much younger age. If you would like more assistance on the exact procedure for giving yourself the finger-prick glucose test, we are putting up a video of this on our site at GDRP.me
YES! YOU CAN GROW BACK NEW BETA-CELLS
Since the American Diabetes Association states 75% of people with a morning blood sugar between 100 and 125 will develop full-blown diabetes within 10 years - you certainly want to do whatever possible to keep from joining that club.
What is very exciting is that repeated studies clearly show humans do in fact have the ability to regenerate new beta-cells in the pancreas - and apparently a lot more than previously thought! Regeneration has been found to occur from at least 3 different locations inside the pancreas and possibly other areas outside the pancreas. One of these is located in a different part of the pancreas known as the progenitor ducts and will literally grow new beta-cells from scratch. Another fascinating discovery was that beta-cells can also form from the simple division of beta-cells themselves (one beta-cell becomes two, etc). Next, new beta-cells have also been found to appear (almost magically) from the altruistic sacrifice of alpha-cells. Alpha-cells reside next to your beta-cells and make up about 20% of the cells in the islets. They work as a counter balance to beta-cells. Instead of lowering blood sugar by producing insulin, alpha-cells release a hormone that raises blood sugar. For example, if your body requires a blood sugar of 90 to function normally, but drops down to the 80's - your alpha-cells release a hormone called glucagon (glucose-on) which signals the liver to release some of its stored glucose to raise your blood sugar. However, if beta-cell numbers become too low to produce enough insulin, your alpha-cells (like a catepillar to a butterfly) will transform themselves into insulin making beta-cells. Now that's what I call a friend...
DON'T WAIT UNTIL IT IS TOO LATE
This massive effort ongoing inside your pancreas to keep insulin at needed levels may be happening right now undected. However, if you take the time to do the $15 finger-prick blood sugar test you can immediately find out if you are close to diabetes and can do what is necessary to prevent it from appearing.
